It's 2020: A Look Back at the 2013 "Recovery"
Axel Merk, Merk Investments Sep 11th, 2013 It’s September 2013 and the U.S. is contemplating military action against Syria. As fear is mounting, investors shrug off the dangers ahead. It’s only with the benefit of history that we will know how events unfolded: how stocks, bonds and the U.S. dollar fared.
Before we dive into this analysis, be forewarned that we are writing from the fictitious viewpoint of 2020. We have no way of knowing whether what we write will happen. We did not come back from the future and events might unfold differently. Proceed at your own risk. As the U.S. was getting ready for military action in September 2013, the warning signs were abundant:
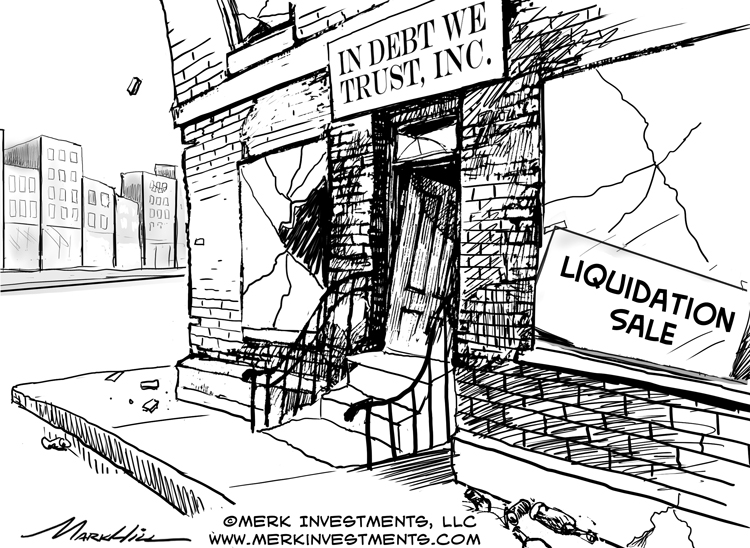
Bubble indicator flashing The bubble indicator referred to above cautioned about tech stocks in the late 90s and suggested easing on stocks in 2013. The indicator measures complacency: when everyone thinks they know where the market is going, implied volatility in that asset class goes down. The dogma of “stocks for the long run” becomes reestablished and a rising equity market becomes self-reinforcing. The more stocks rise the more popular they become and the more risk becomes mispriced. Looking at a long-term chart of the VIX index, a popular measure of implied volatility in the U.S. equity market, equities look to be very close to the low end of their range at a time when stocks are near all time highs. Caution: the sections “October 2013 Flash”, “Great Recovery” and “Dollar Crash?” are entirely fictitious. While it may be possible for events to unfold as discussed, we have no way of knowing. The discussion serves as an illustration of the sort of risk scenarios that might unfold, but is not to be construed as investment advice. October 2013 Flash Stock investors in October 2013 felt like gold investors earlier that year. Someone decided to take profits from what appeared to have been an endless rally. And this time around, others did not pile in to “buy the dip.” In fact, high frequency trading algorithms noticed the unusual pattern in the market and opted to pull their bids. It first appeared like a flash crash as prices plunged. But past flash crashes had the habit of rebounding within seconds- this one was different. It was painful. The bids didn’t come for what seemed to be an eternity. Margin calls followed, further extending the pain. It became known as the October 2013 Flash, or simply the “Flash.” Great Recovery The doomsday predictors didn’t like it, but we recovered from the Flash. It took a while, but the pundits got what they were asking for: economic growth. Except that it didn’t play out the way the cheerleaders wanted it to. As the economy picked up steam, bonds continued to slide. We were told that it was good news as the economy was healing. We will spare you the details, but someone finally looked up the numbers: in 2001, the average cost of borrowing for the U.S. government to borrow money in the market was over 6%. In August 2013, that average cost dipped below 2%. It didn’t happen overnight, but it’s now 2020. We won’t spoil the surprise for you, but the market started to have concerns that meaningful entitlement reform wouldn’t happen. It’s 2020, and it didn’t. Now interest rates are not only high, but the average cost on all debt servicing has moved up. How much? Kids may be reading this, so we can’t put these numbers in print. The details, in fact, don’t really matter, as it is the perception that counts. Once confidence was lost that the U.S. could service its debt in real terms, the market didn’t care about the rhetoric of policy makers that the U.S. wouldn’t ever default because it can print its own currency. Dollar Crash? And as the Federal Reserve was called upon to help finance government deficits, we could tell you what unfolded. We could tell you whether the dollar crashed. But we don’t want to spill the beans for our readers. Let us just ask: what’s your assessment of the risk of this scenario unfolding? By the way, the 2020 Olympics took place all right, but the IMF had to step in as Japan was unable to finance the completion of construction. Athletes had to pledge their sponsorship deals as collateral as the IMF would have otherwise been unable to access funding. Back to Reality Okay, we got ahead of ourselves. It’s utterly unrealistic for the IMF to step in to finance the 2020 Olympics. To distinguish fiction from reality, let’s not veer that far into the future, but look at what is next for the dollar in the context of the Fed’s taper talk. Please register to join us for our Webinar entitled, “What’s Next for the Dollar? #Taper” to continue the discussion on the fallout for the U.S. dollar and currencies of Fed policy. Also make sure you subscribe to our newsletter so you know when the next Merk Insight becomes available. Axel Merk
The outcomes described herein are suppositions or fictious and there can be NO ASSURANCE that the trends described will come to pass at any time, present or future. |